My colleagues and I recently completed an analysis of the 2018 Annual Business Survey to identify the state of Black-owned business on the eve of COVID-19. To refresh: our topline finding showed that there are 124,000 Black-owned employer firms in the US, representing only 2.2 percent of all employer businesses. Black-owned employer businesses in the U.S. are smaller, with fewer employees, lower average revenues, and lower average payroll expenditures, than businesses overall. A key — but not sole — reason for this is because these firms concentrate in sectors of the economy that pay less and offer fewer opportunities for productive growth.
This week we drill down further to assess the varied performance of the states on this important topic. This assessment is timely given the important role that states have taken on during the COVID-19 crisis and the underlying powers and resources they have at their disposal.
Initial Findings
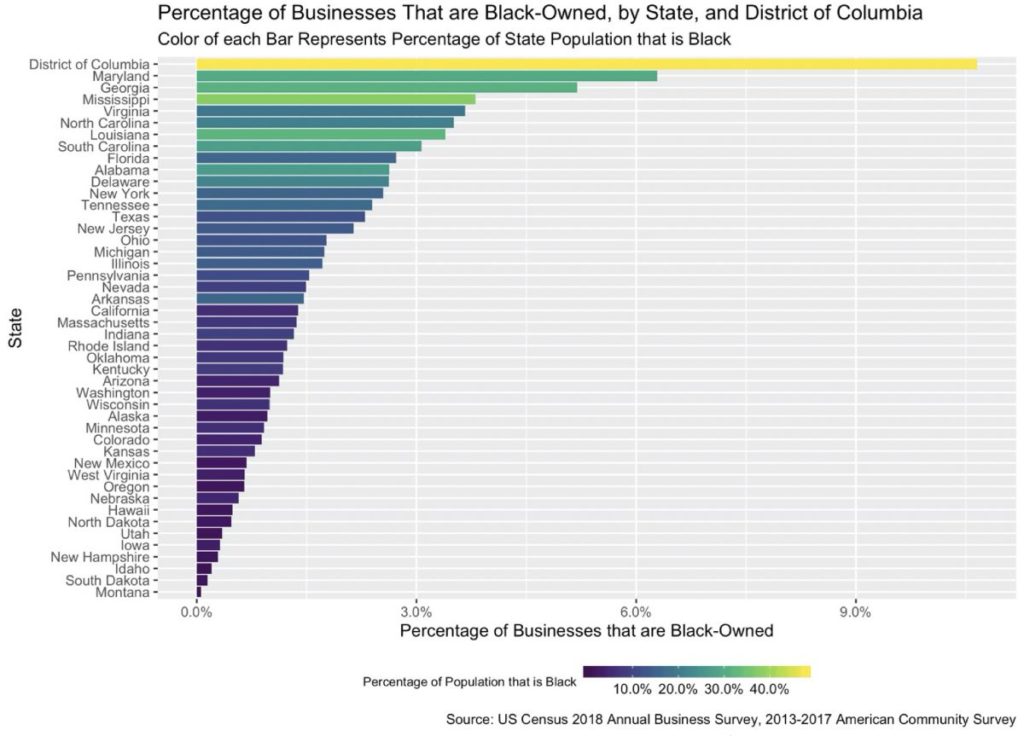
Unsurprisingly, Black-owned businesses are concentrated in states that have large Black populations.[1] By raw numbers, Florida, New York, California, Texas, and Georgia lead the nation in the number of Black-owned businesses. This should not come as a surprise, however, as these five states also lead the nation in Black population, with more than 2.2 million Black inhabitants each, as of 2017. Similarly, the percentage of businesses that are Black-owned is large in states where a significant proportion of the state population is Black. The District of Columbia (DC), Maryland, Georgia, and Virginia have the highest proportion of businesses that are Black-owned: ranging from 10.7% of businesses in DC, to 3.7% in Virginia. At the same time, the proportion of the population that is Black among these four jurisdictions ranges from 19% in Virginia, to 48% in DC.
n order to understand patterns of Black-owned Businesses at the state level, it’s important to adjust for the number of Black inhabitants in a given state. Starting with the national level, there were approximately 55 inhabitants for every employer business in the US in 2017. Among the states, that number ranges from 75 inhabitants per business in West Virginia, to 32 inhabitants per business in Montana. For Black-owned businesses, those numbers are drastically higher. The “best” performing state is Oregon, a state whose population is only 1.9% Black: 129 Black inhabitants per Black-owned business. Mississippi, on the other hand, has 715 Black residents per Black-owned business; its large Black population makes its otherwise impressive count of 1,600 Black-owned businesses fall short. Among states and territories with a Black population that is greater than 10% of the total population, DC performs best, with 201 Black residents per Black-owned business, compared to 44 residents per business overall. Maryland, right next door, comes in second, with 271 Black residents per Black-owned business.
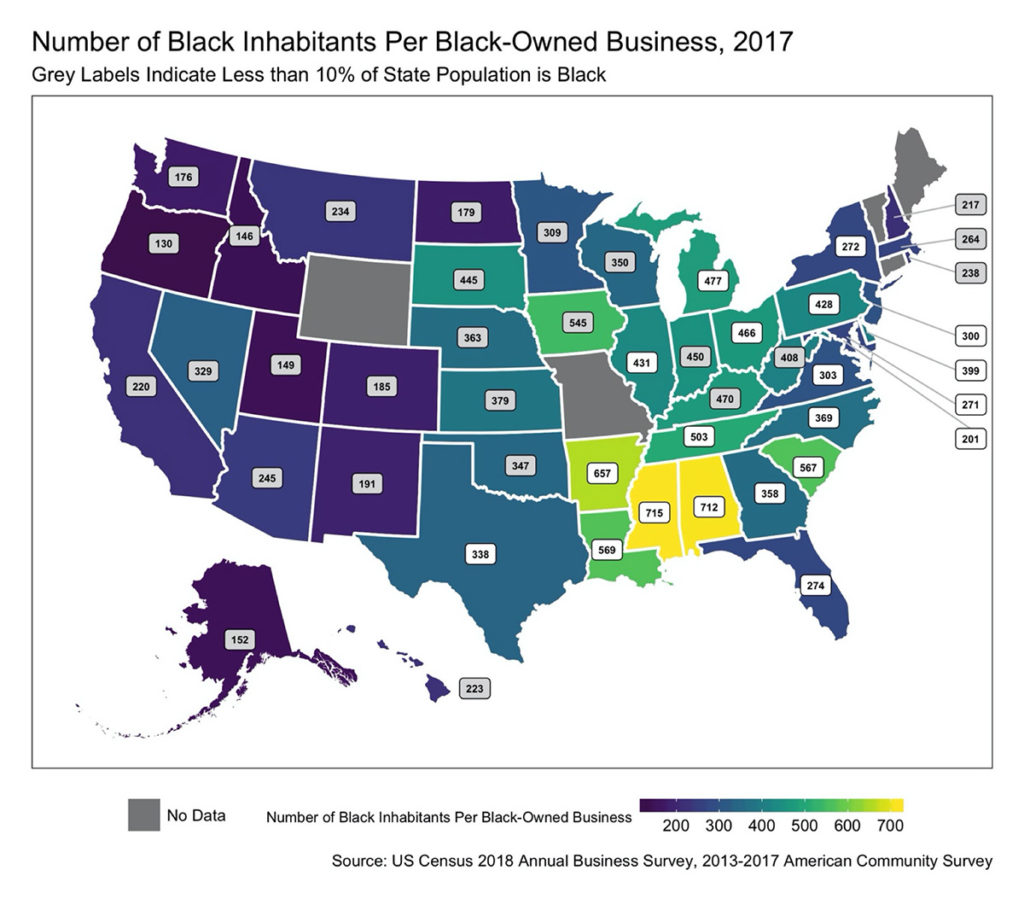
What do these trends tell us? Those states whose Black population is relatively small technically perform well. However, we know that places like Oregon historically excluded Black residents,[2] and other states, like California, tried to do the same.[3] Though the ratio of Black inhabitants to Black-owned businesses may be smaller in states without a large Black population, that isn’t likely because of state initiatives, it’s simply because those states have a smaller numerator. The worst performing states, by contrast, are largely in the Deep South. Here, we’re likely seeing the impact of Jim Crow. As Mehrsa Baradaran lays out in her book The Color of Money, Black business owners were kept out of the traditional banking sector in the South, and most Black-owned banks made residential real estate loans, rather than engage in commercial lending. Southern states generally have a ratio of inhabitants to businesses that is higher than the nationwide average — approximately 70 inhabitants per business in Mississippi, Tennessee, and Alabama. Structural racism, combined with lower average rates of business ownership, likely contribute to the poor performance of the Deep South. Finally, muddling somewhere in the middle is the Midwest and Mid-Atlantic, with approximately 300-400 Black residents per Black-owned business in places like Ohio, Pennsylvania, Michigan, and New Jersey. As we note later in this newsletter, these states may have Minority- and Women-Owned Business contracting goals that may contribute to their better numbers among states with a larger share of Black residents. However, compared with the average of 55 inhabitants per business for all businesses in the US, no state performs well along this metric.
As at the federal level, state-level information from the Annual Business Survey provides breakdowns of the number of businesses by industry and by race of the owner. Again, owing to their large Black populations, D.C., Georgia, and Maryland all lead with the number of industries that have more than 10% of firms that are Black-owned. In fact, nearly 30% of construction-related businesses in DC are Black-owned. Both “Health Care and Social Assistance” and “Transportation and Warehousing” also represent industries with high concentrations of Black-owned firms across these three states. Other Black-owned business clusters that emerge include:
- Manufacturing in DC
- Educational Services in Delaware and Maryland
- Finance and Insurance in Maryland
- Agriculture-Forestry-Fishing and Hunting in Virginia
- Management of Companies and Enterprises in Virginia
- Professional, Scientific and Technical Services in Maryland
- Arts, Entertainment and Recreation in North Carolina
Examining growth trends between 2012 and 2017, the very large inter-state variation in relative number of Black-owned businesses produces significantly different results. For example, North Dakota tops the nation for growth of Black-owned businesses, with an increase of 288 percent between 2012 and 2017 — from 25 to 97 businesses. To compare changes between 2012 and 2017, we want to look at states that have relatively larger Black populations. Among states with a Black population greater than the median, Massachusetts and New York are top performers, with an increase of 44 percent in Massachusetts, and 33 percent in New York, representing approximately 600 and 3,000 new businesses, respectively. Other states that saw large growth of their Black-owned businesses include New Jersey, Florida, Pennsylvania, and Maryland, all growing more than 10 percent.
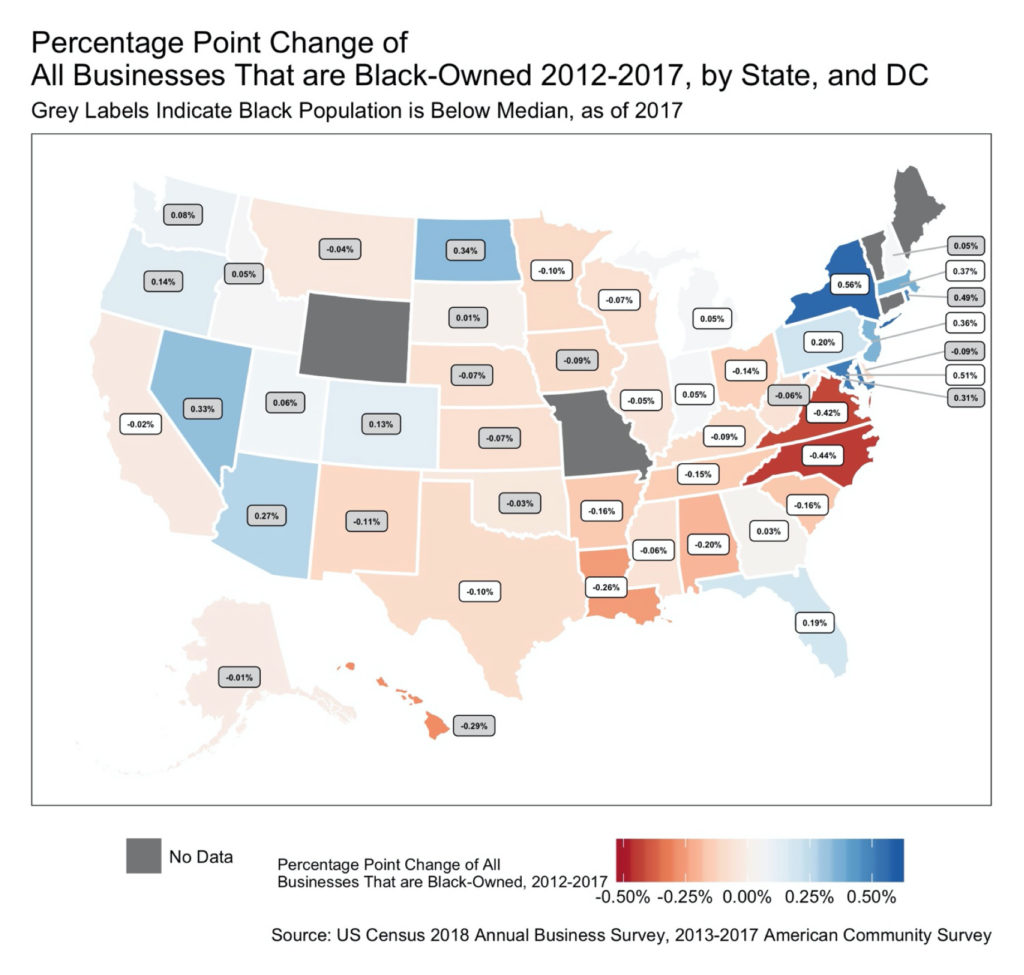
In addition to the proportional growth of Black-owned businesses, one might consider the relative market share of Black-owned businesses, which would account for Black-owned businesses growing at a faster or slower rate compared to the state’s entire business ecosystem. Comparing relative market share between 2012 and 2017 yields similar results, though at a much smaller scale, shown in the following map. New York and Maryland again top the list for Black-owned businesses growing faster relative to the size of the state’s total number of businesses. North Carolina, Virginia, and Louisiana lost total and relative market share of their Black-owned businesses. Importantly, four states saw an increase in their number of Black-owned businesses while still having a decrease in the relative market share: California, Illinois, Texas, and South Carolina. States must try to grow their Black-owned businesses at a faster rate than the economy as a whole, to ensure that gains aren’t eclipsed by faster growth from the rest of the economy.
What this Means
This analysis leads to one overarching conclusion: we need a radical transformation in state policy and practice to stabilize Black-owned businesses due to the COVID-19 crisis and drive meaningful growth in their number, size and sector representation.
Some of this is already happening. States are playing a key role in helping (very) small businesses survive the crisis, with their own capital as well as resources provided through the CARES Act. In both cases, states have tended to target businesses with fewer than 20 employees (Small Business Administration programs serve businesses with less than 500 employees) and provide capital that is more fit to the needs and financial capacity of affected firms.
Like cities, states started early to establish loan and grant funds with clear targets and flexible resources. In late March, Iowa announced the creation of the Small Business Relief Program, offering businesses with less than 25 employees grants ranging from $5,000-$25,000, a deferral of sales and use or withholding taxes due and waiver of penalty and interest. In early April, California mobilized to make $1 million available for the microlending Jump Start Loan Program, meant for low-wealth entrepreneurs requiring loans between $500 to $10,000. In early April, Washington state launched its $5 million Working Washington Small Business Emergency Grant Program, offering grants of up to $10,000 for businesses with up to 10 employees.
As the crisis evolved, a few states used more sophisticated methods to design and deliver funds. In late May, New York, for example, launched the New York Forward Loan Fund (NYFLF), a new $100 million public-private economic recovery loan program aimed at supporting small businesses, nonprofits and landlords as they reopened after the COVID-19 outbreak. Unlike PPP, the terms and conditions of the loans reflected the kind of flexible working capital that small businesses need to survive a crisis with no certain endpoint. (Loans were provided up to $100,000 at a rate of 3% for small businesses and 2% for nonprofits with no fees).
The capitalization of the NY Fund was also innovative. The state seeded the Fund with $20 million in loan loss reserves that was then leveraged by senior and subordinate lenders to create a $100+ million facility. The loans were originated by five trusted Community Development Financial Institutions (CDFIs) — Accion East, Community Preservation Corporation (CPC), National Development Council (NDC), Pursuit, and TruFund — each of which were given a lending allocation to meet the needs of the communities they serve.
The NY Fund and the early State Funds were uniformly undercapitalized and oversubscribed. During its initial application phase for $5 million in grants, Washington received an estimated 25,000 applications, conveying a need of $250,000,000 if each applicant received a $10,000 grant. Washington then announced a second application phase making $10 million more available in grants. Iowa extended $24 million in grants in its first funding phase alone, and after thirty-three rounds of grantmaking, it closed and does not plan on opening a new round of applications. South Dakota Governor Noem’s Small Business Relief Fund approved 200 loans totaling $10.5 million, and then permanently closed.
To that end, a number of states moved in the past few weeks to allocate a portion of the $150 billion CARES Act Coronavirus Relief Fund (CRF) for small business relief. Pennsylvania, for example, allocated $225 million CRF dollars to a grant program for small businesses. $100 million will go to the Main Street Business Revitalization Program and another $100 million will go to the Historically Disadvantaged Business Revitalization Program, which supports small businesses that are at least 51 percent owned and controlled by socially and economically disadvantaged individuals. In both cases, the state will allocate grants through the state network of CDFIs. The remaining $25 million allows CDFIs the opportunity to offer forbearance and payment relief for existing business clients that are struggling due to COVID, as well as support CDFIs experiencing a significant increase in defaults in their existing loan portfolios.
New Jersey, for its part, has allocated $50 million in CRF dollars to expand the Small Business Emergency Assistance Grant Program, which provides grants of up to $10,000 and relaxes eligibility criteria to include home-based businesses and sole proprietorships. $15 million dollars are reserved for businesses in Opportunity Zone-eligible census tracts.
These examples show that a growing number of states understand their critical role in providing Black-owned businesses with the capital they need to survive this crisis. But more needs to be done going forward to help grow such enterprises.
Three strategies are of utmost importance:
- First: states need to deploy their spending in ways that create demand for starting and expanding Black-owned businesses. States are major investors in infrastructure (particularly roads) and the K-20 system: elementary and secondary schools for sure but also community colleges and 4-year public universities. States should require that a substantial portion of infrastructure and education spending be set aside for businesses owned by women and people of color.
New Jersey, for example, has a Small Business Set-Aside Program, which requires each state department to make a good faith effort to award 25% of total state contracts for goods and services to small businesses. Eligible businesses must be relatively small (no more than 100 full-time employees), a woman or minority owned business, or a veteran or disabled veteran-owned business. Moreover, individual agencies like the New Jersey State Education Authority, specifically advocate and encourage subcontracting awards to minority and/or women-owned firms on school projects.
In a joint state venture, thanks to the leadership of the Port Authority of New York and New Jersey, each year hundreds of minority, women, small, and disadvantaged-owned businesses participate in running the world’s largest airport system, the east coast’s biggest seaport, and the region’s most active bridges, tunnels, and terminals. With a capital plan of $32.2 billion, The Port Authority strives to award 20% of contracts to minority-owned businesses, and 10% of contracts to women-owned businesses. The Port Authority also encourages its partners to replicate its diverse spend goals.
- Second: states should use their ample regulatory power to boost demand for businesses owned by people of color. Regulators like the Maryland Public Service Commission have made huge strides in increasing opportunities for women-, minority- and service- disabled veteran-owned businesses to compete for contracts and subcontracts with public utilities. In 2018, Maryland utilities spent close to $1 billion with diverse contractors and almost half of the companies that filed annual reports met or surpassed the Commission’s 25% diverse spend goal. In 2018, diverse spend for Maryland utilities was over $800 million.
In the mid-1980s, California also passed legislation to encourage the award of a fair proportion of total utility contracts to women and minority-owned businesses. Thanks to this bill, the California Public Utilities Commission (CPUC) launched their highly impactful Utility Supplier Diversity Program. In 2018, its 30th year, California utilities reached $12 billion in diverse procurement, a record high since the program started. The CPUC Utility Supplier Diversity Program promotes and monitors utilities’ procurement from women-owned, minority-owned, disabled veteran, and LGBT-owned business enterprises (otherwise categorized as diverse suppliers). The Program encourages utilities to purchase at least 21.5 percent of their procurement from diverse suppliers: 15 percent from MBEs, 5 percent from WBEs, and 1.5 percent from DVBEs. Utilities are also required to annually report their procurement performance and future program enhancement plans.
State regulation of utilities can extend to other sectors. For instance, state financial regulators should consider instituting diverse procurement expectations or requirements for the financial institutions they license, enabling lenders to further support and invest in the state businesses they already serve.
- Lastly: states should create broader ecosystems for nurturing, growing, and capitalizing minority-owned businesses to create paths toward broader community-oriented wealth building. Most states have built thick and textured ecosystems for supporting tech startups and scale-ups: universities, incubators, accelerators, angel and seed funds, mentor groups, etc. The ecosystem for growing Black- or Latino-owned businesses is less developed and — crucially — less funded. To rectify this deficiency, states should enact and capitalize Minority Business Accelerators, modeled after the highly successful initiatives undertaken in Cincinnati and elsewhere.
The Cincinnati Minority Business Accelerator, long backed by major corporations, has a portfolio of firms that are Black- and Hispanic-owned, with annual revenues of $1 million or more and with the potential for accelerated growth within two to five years. The accelerator has a three-pronged strategy, armed with a new Kauffman Foundation grant. It seeks to identify 50 growing companies over the next five years as part of its portfolio. It is also working with REDI Cincinnati, the lead economic development agency for the region, to bring more minority firms into the manufacturing, aerospace, and chemicals sectors. It has about 200 prospects. Finally, the accelerator is seeking to grow minority businesses by acquiring other businesses with no succession plans.
The COVID-19 crisis and the civil unrest roiling this country has reminded us of the power of states in supporting small businesses in general and Black-owned businesses in specific. Our review of the latest Annual Business Survey shows that these powers should be put to work, at scale, both to stabilize businesses and grow new ones. This work is more important — and urgent — than ever.
Kevin Gillen is a Senior Research Fellow at the Lindy Institute for Urban Innovation at Drexel University.
Ben Preis is a Doctoral student at MIT’s Department of Urban Studies and Planning and is currently a Graduate Research Analyst at the Nowak Metro Finance Lab at Drexel University.
Sharon Velasquez is a Master in City Planning Candidate at MIT and is currently a Graduate Research Analyst at the Nowak Metro Finance Lab at Drexel University.
[1] Missouri, Connecticut, Maine, Vermont, and Wyoming are excluded from this analysis. The Census Bureau did not release information regarding the number of Black-owned businesses in Connecticut, Maine, Vermont, and Wyoming. Missouri is excluded due to difficult-to-explain changes from the 2012 results, possibly due to survey changes.
[3] https://www.history.com/news/california-once-tried-to-ban-black-people